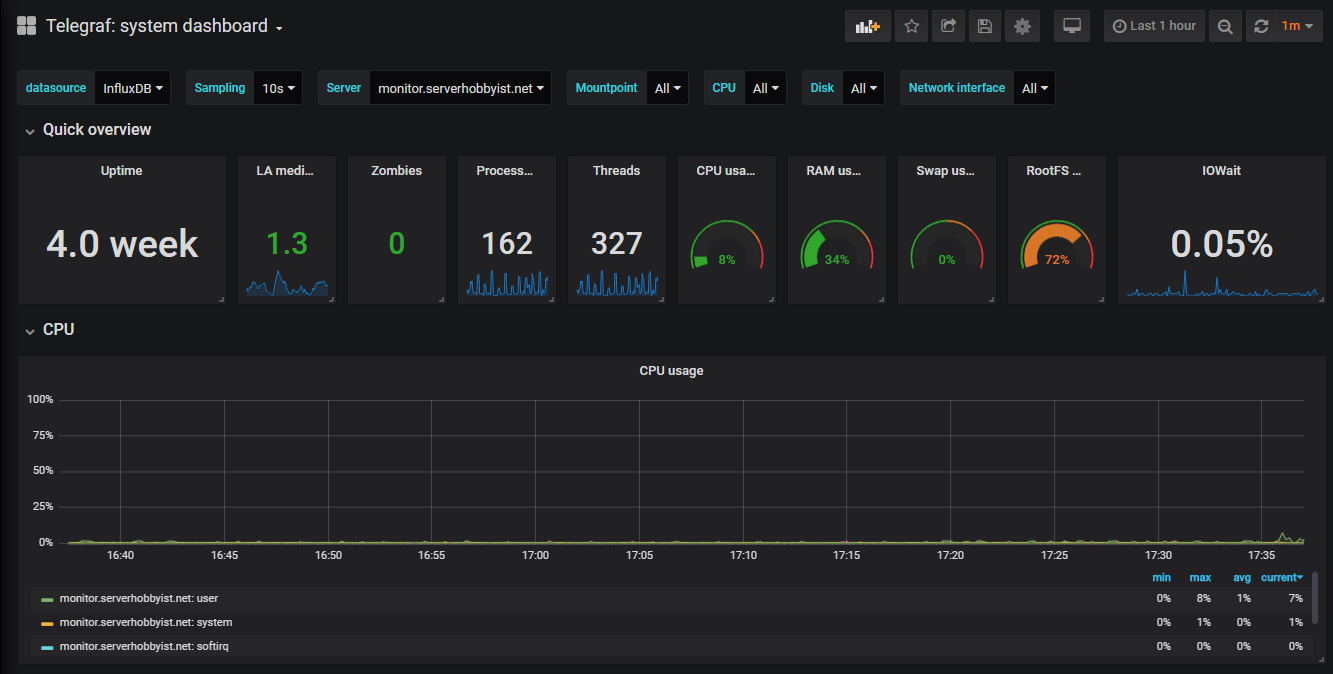
Monitoring is one of those things I’ve seen get overlooked. Throwing money at it doesn’t always make it better. Taking the time to sit down and understand and doing proper event management is key. Of course I say all of that and I don’t always practice it, especially on my own personal infrastructure. I think I go beyond the basics however. Originally I would just set up nagios and get emails and texts when a server didn’t respond to ping. Finding something that can monitor and alert on performance was more challenging. I ended up settling using the telegraf agent and having it send to an influxdb instance. Then grafana interprets the influxdb data and makes it into pretty visuals.